Metrics
Overview
SIP3 uses vendor-neutral application metric facade called Micrometer. It allows SIP3 to send multi-dimensional QoS metrics to the most popular monitoring systems such as CloudWatch, Datadog, Elastic, InfluxDB, New Relic, Prometheus, etc.
Please read Micrometer Documentation to get more information about basic concepts, metric types, dimensional data models and specific implementation details.
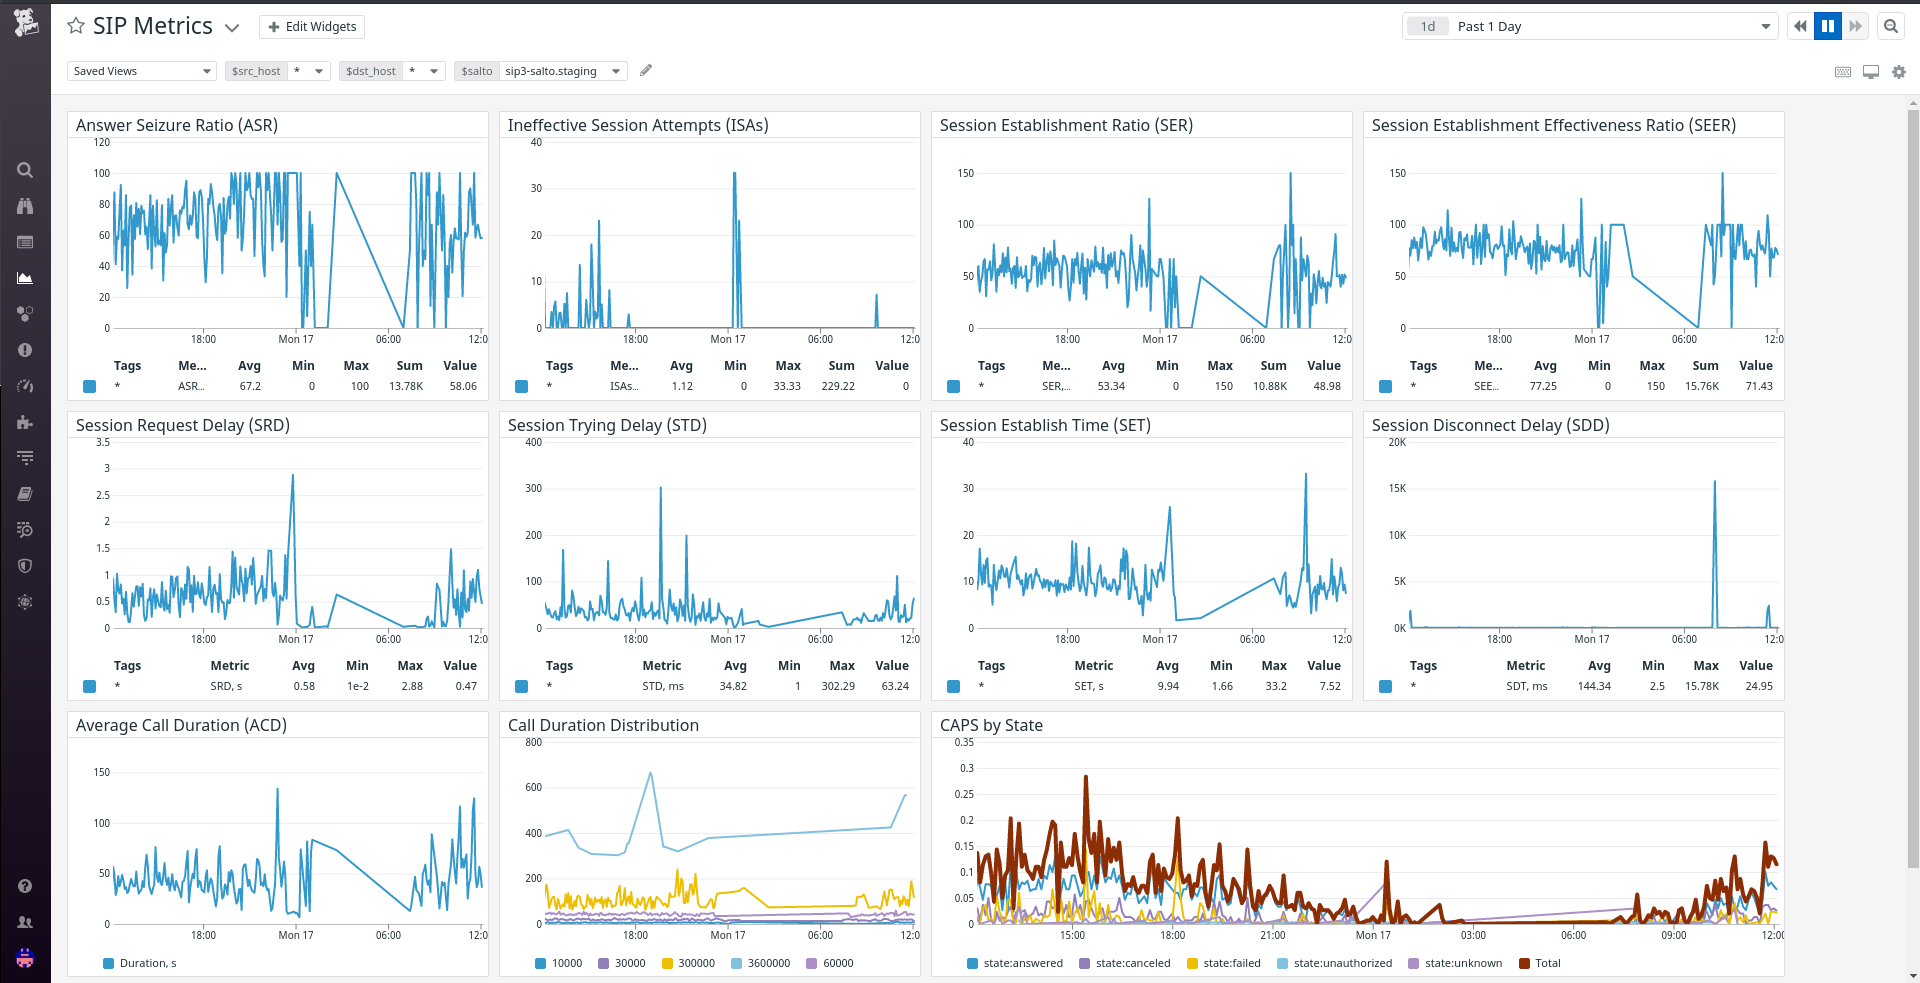
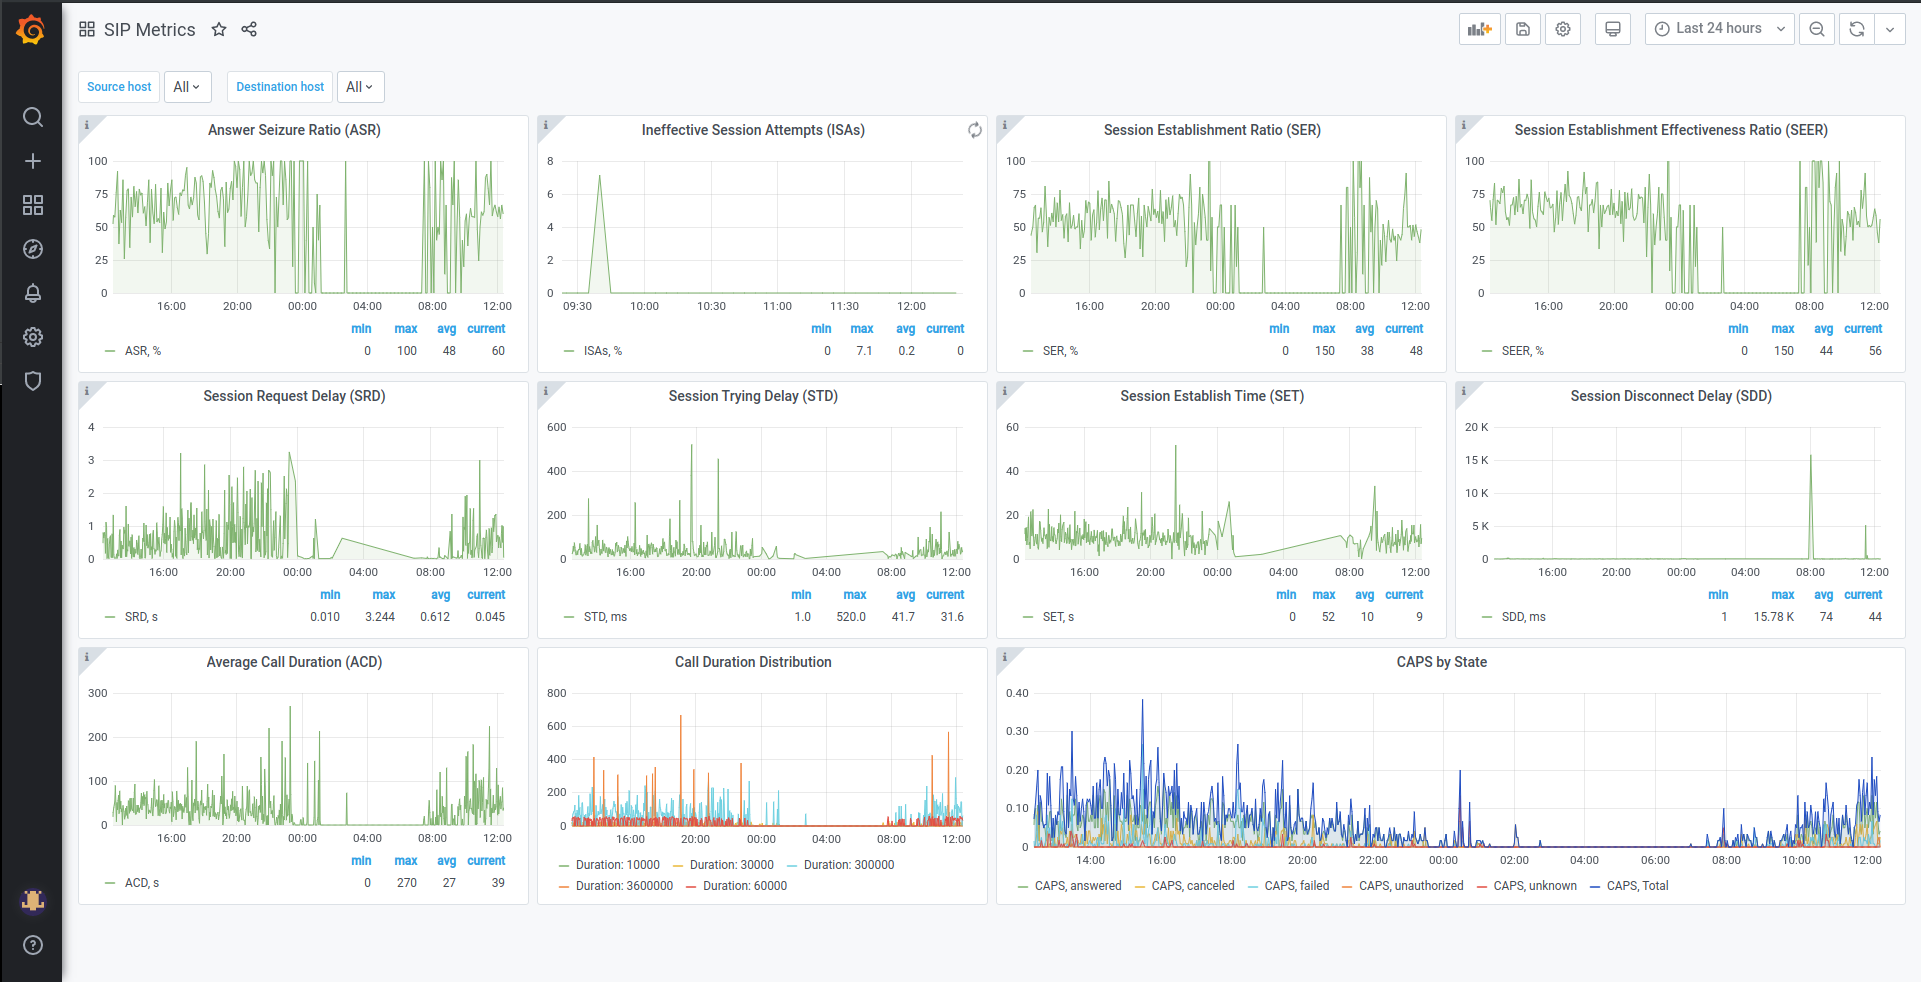
SIP Quality of Service Dashboard
You can use SIP QoS Metrics to retrieve the most important QoS metrics described in RFC 6076 and build informative dashboards for monitoring and troubleshooting
Datadog:
Grafana:
Building a chart
Under the hood of most charts there are simple expressions. Let’s look closer to Answer Seizure Ratio (ASR) metric with formula:
\$ASR = "Seizures resulting in answer signal"/"Total seizures" * 100\$
In the case of using InfluxDB and Grafana query for chart will be:
SELECT sum(Answered)/sum(Seizure)*100 FROM
(SELECT sum("value") as Answered FROM "sip_call_attempts" WHERE ("state" = 'answered') AND $timeFilter GROUP BY time($__interval) fill(null)),
(SELECT sum("value") as Seizure FROM "sip_call_attempts" WHERE $timeFilter GROUP BY time($__interval) fill(null))
GROUP BY time($__interval) fill(null)
For Datadog query is pretty simple:
(sum:sip_call_attempts{state:answered}.as_count()/sum:sip_call_attempts{state:*}.as_count())*100SIP Metrics
The list below contains entire set of SIP QoS metrics aggregated and reported by SIP3. You can use it to retrieve the most important QoS metrics described in RFC 6076.
| Name | Type | Tags | Description |
|---|---|---|---|
|
Counter |
|
Call messages |
|
Counter |
|
Call attempts |
|
Counter |
|
Call transactions |
|
Counter |
|
Call retransmits |
|
Timer |
|
Call duration |
|
Counter |
|
Established calls |
|
Timer |
|
The time interval between initial |
|
Timer |
|
The time interval between initial |
|
Timer |
|
The time interval between initial |
|
Timer |
|
The time interval between the first |
|
Timer |
|
The time interval between SIP request message and corresponding response |
|
Counter |
|
Registration messages |
|
Timer |
|
The time interval between initial |
|
Timer |
|
The amount of active registrations |
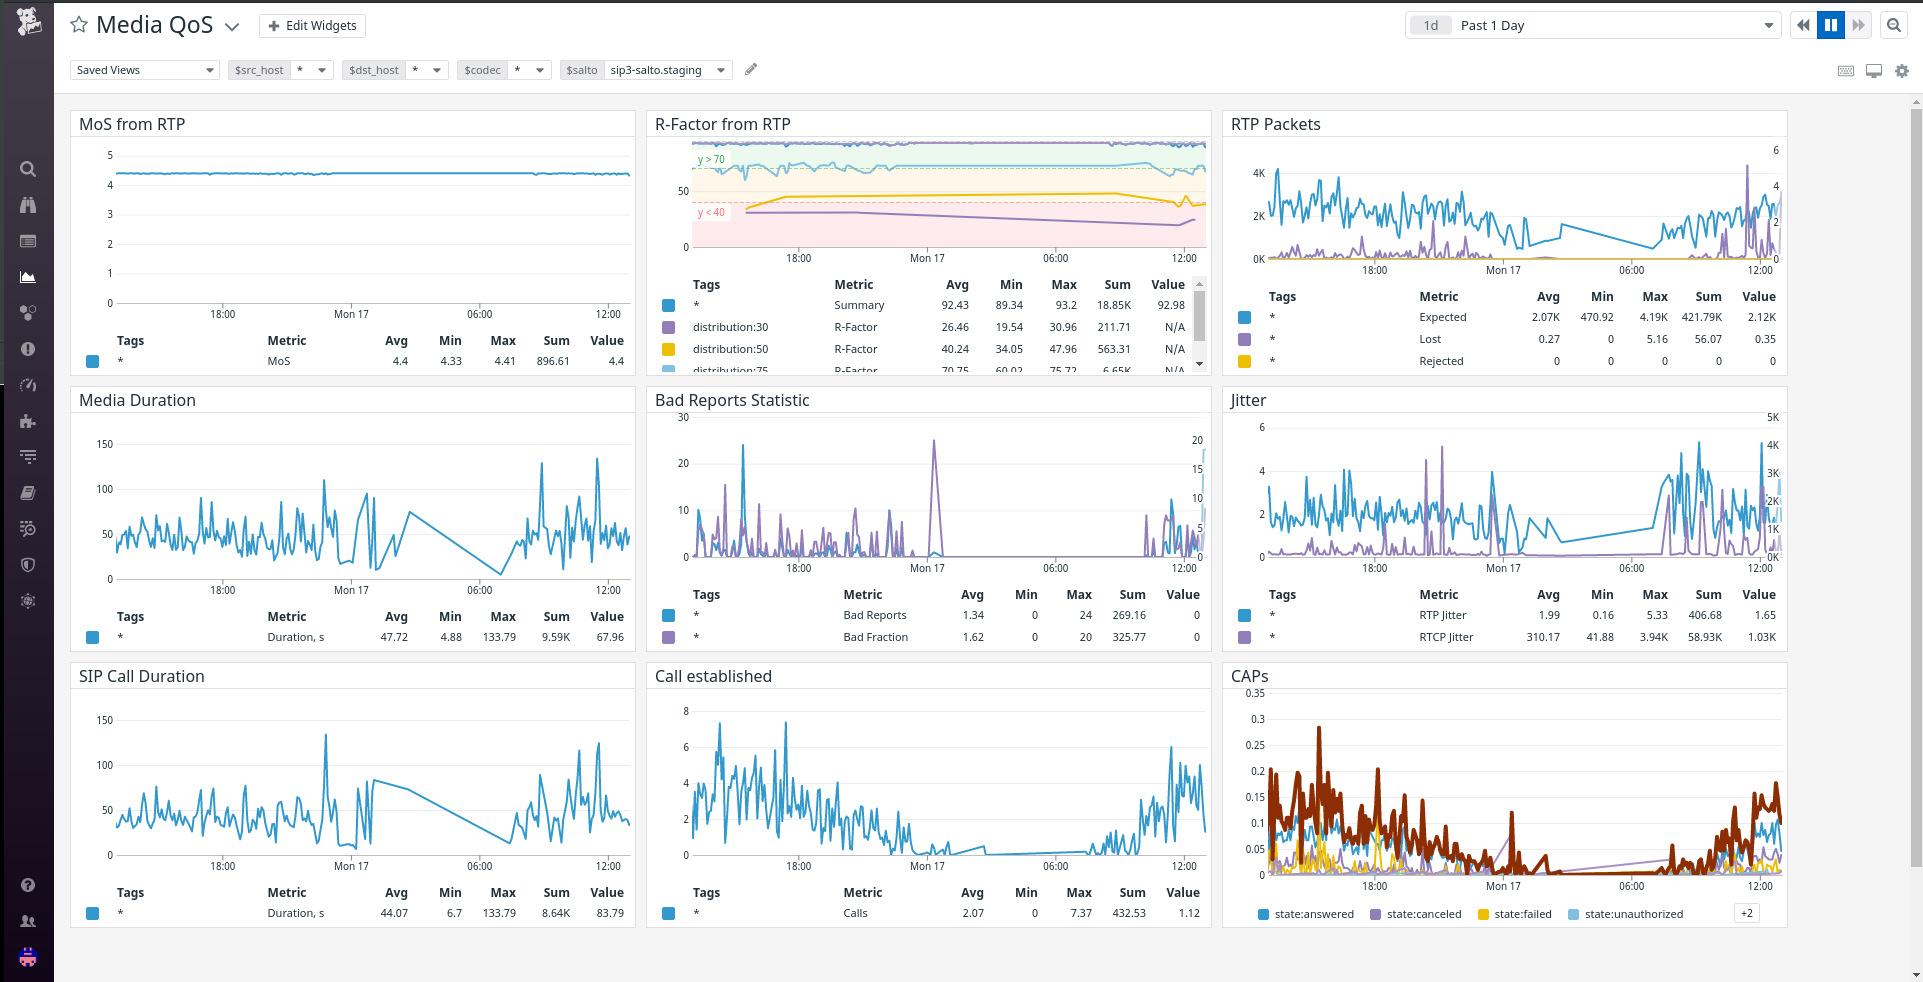
Media Quality of Service Dashboard
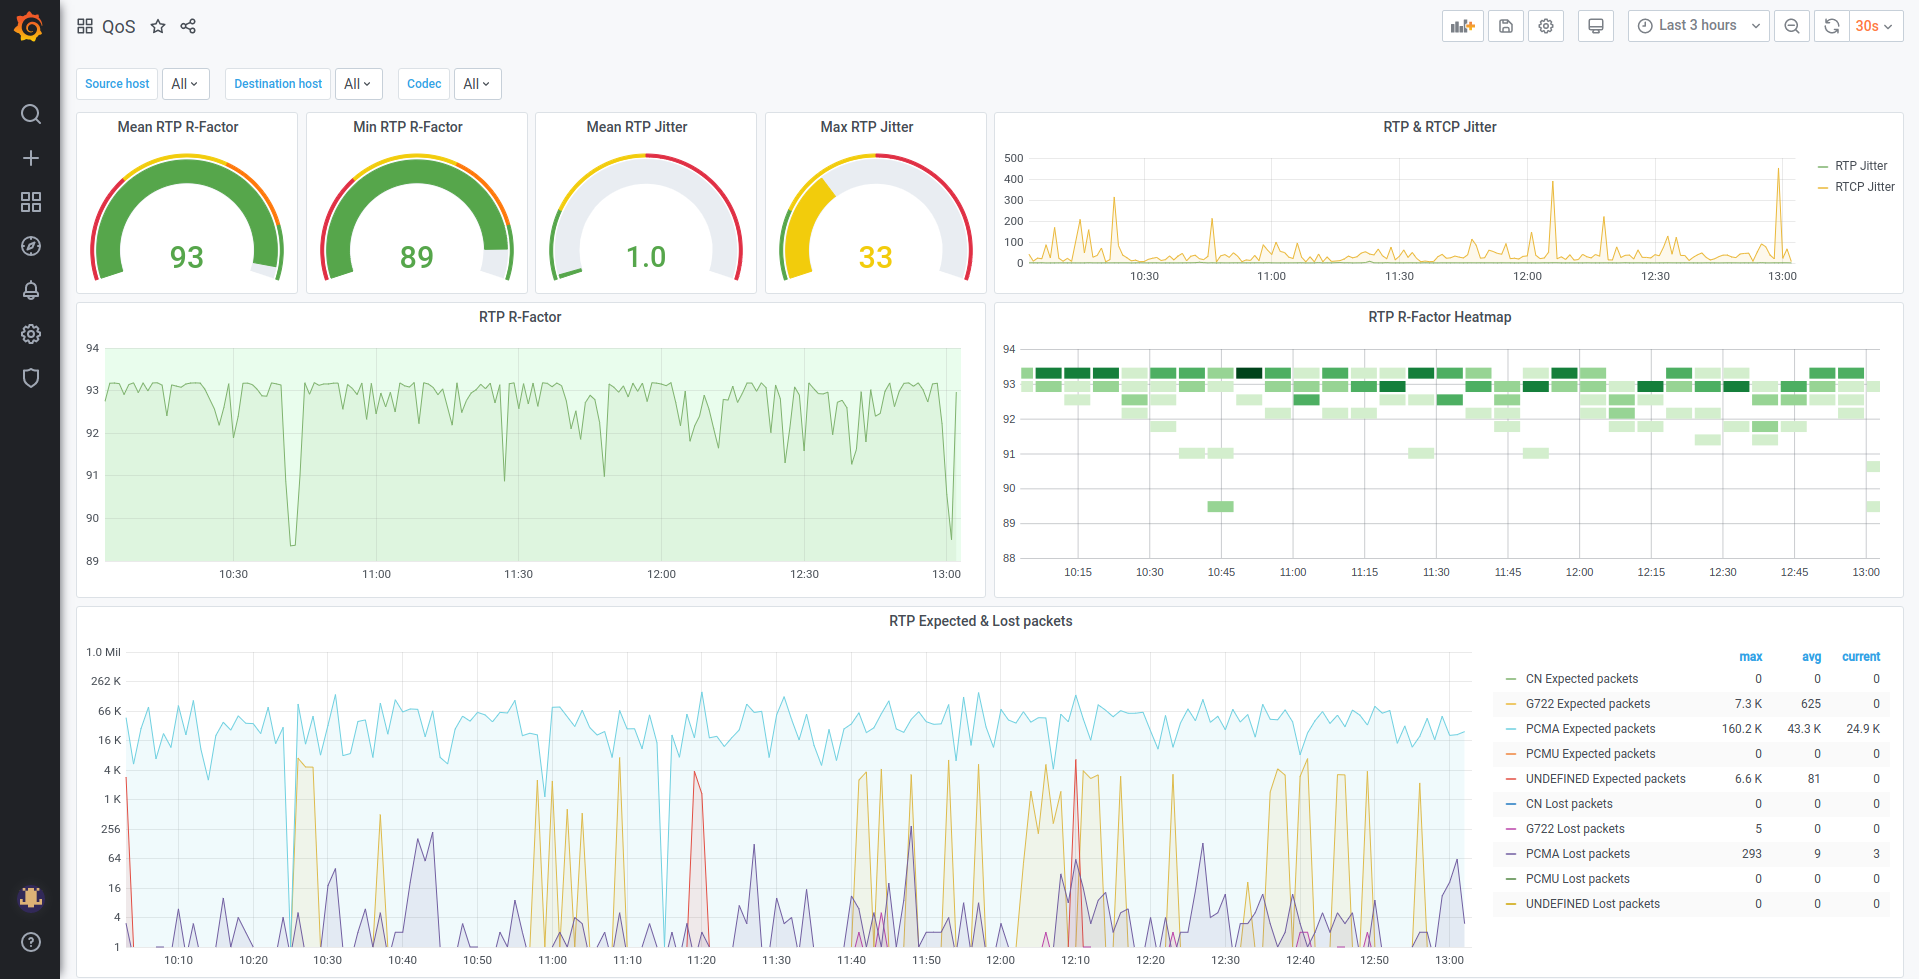
You can use RTP/RTCP Metrics and Media Metrics to retrieve the most important QoS metrics such as R-Factor, Mean Opinion Score(MOS) according to ITU-T Recommendation G.107: The E-model: a computational model for use in transmission planning, Jitter, etc. Creating Dashboards with this metrics helps to investigate Media issues more effectively:
Datadog:
Grafana:
RTP/RTCP Metrics
The list below contains entire set of RTP/RTCP QoS metrics aggregated and reported by SIP3.
| Name | Type | Tags | Description |
|---|---|---|---|
|
Summary |
|
Mean opinion score |
|
Summary |
|
R-Factor |
|
Timer |
|
Call media duration |
|
Summary |
|
Average jitter |
|
Summary |
|
Expected RTP packets |
|
Summary |
|
Lost RTP packets |
|
Summary |
|
Rejected RTP packets |
|
Summary |
|
Number of bad reports |
|
Summary |
|
Bad reports fraction |
|
Timer |
|
RTP/RTCP stream duration |
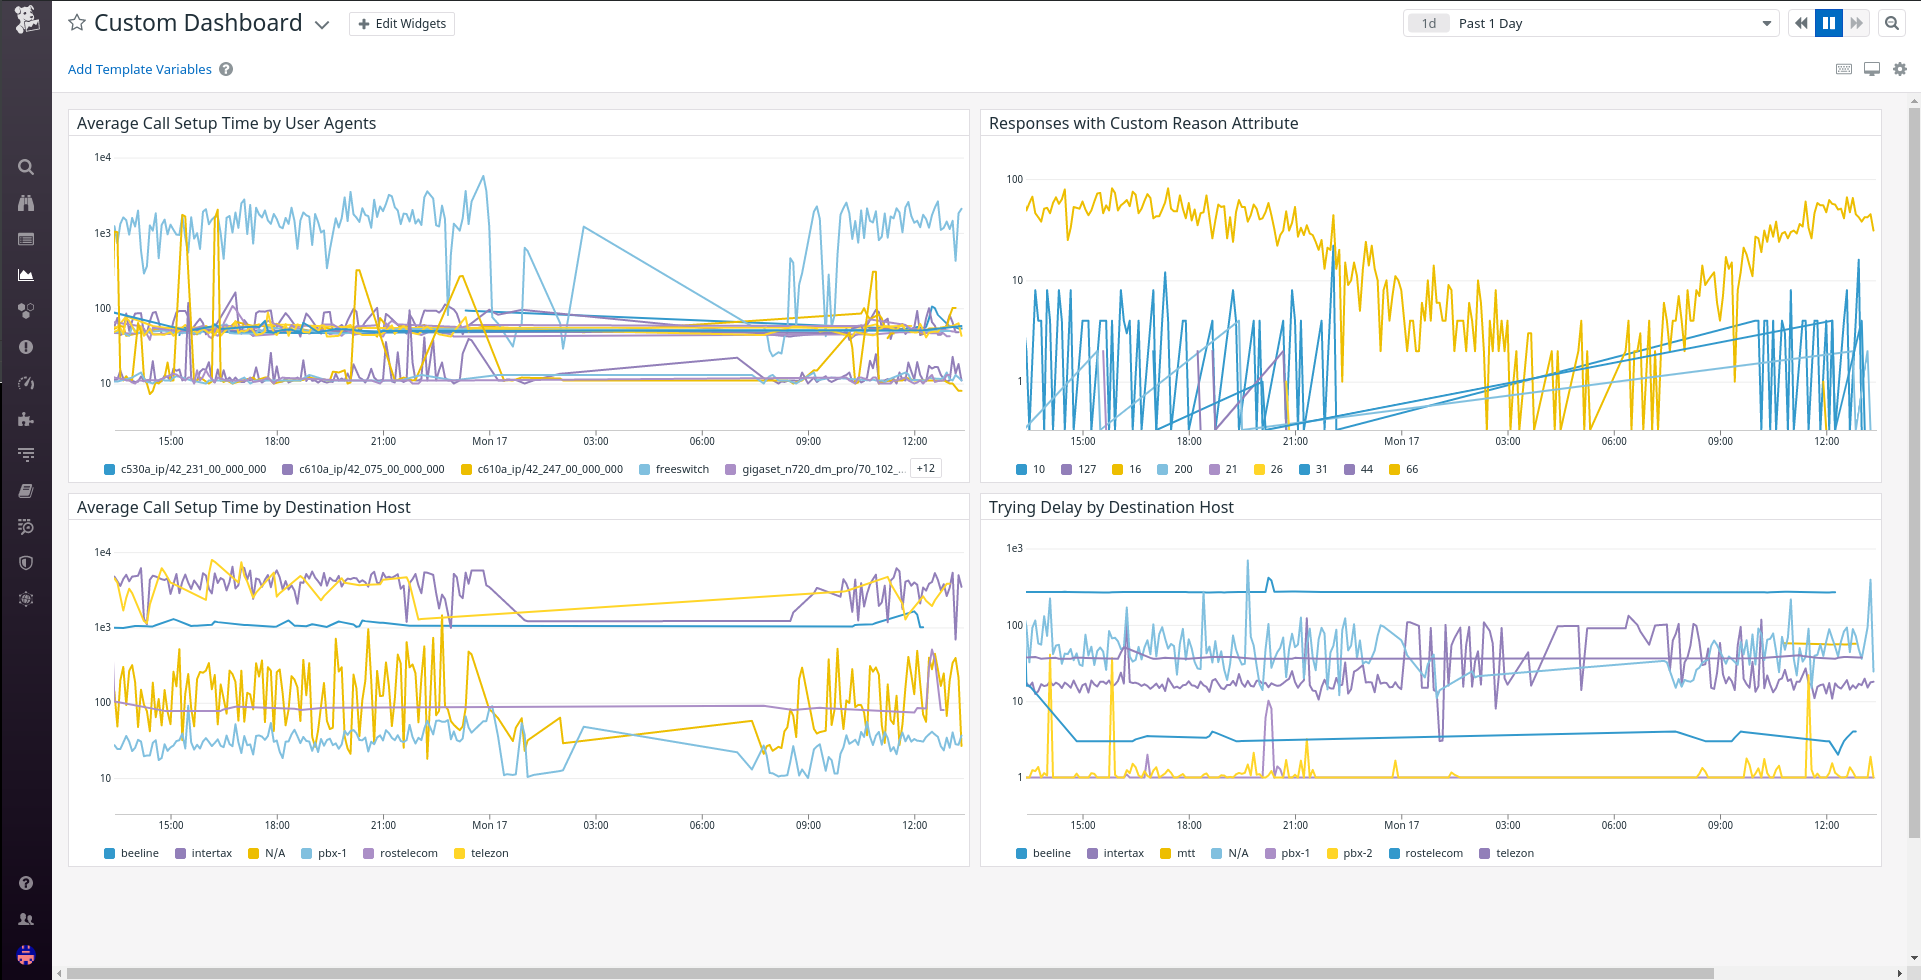
Custom Dashboards
You can build custom dashboards to improve troubleshooting and monitoring. With User Defined Attributes, like User-Agent or custom Reason Attribute:
Datadog: